Pluripotent Proteome
# options
options(stringsAsFactors = F)
knitr::opts_chunk$set(echo = TRUE, warning = FALSE, message = FALSE)
knitr::opts_knit$set(progress = FALSE)
# packages
# qtl mapping + mediation
library(intermediate) # "simecek/intermediate"
# library(intermediate2) # https://github.com/duytpm16/intermediate2
library(qtl2)
# # plotting
library(plotly)
library(ggpubr)
library(ggraph)
library(pheatmap)
library(cowplot)
library(ggbeeswarm)
library(GGally)
library(corrplot)
# annotations + general genomic things
#library(biomaRt)
library(TxDb.Mmusculus.UCSC.mm10.knownGene)
library(org.Mm.eg.db)
library(ChIPseeker)
library(GenomicRanges)
#library(ensimplR) # https://github.com/churchill-lab/ensimplR
library(qvalue)
library(LOLA)
# data processing
library(pcaMethods) # pca
library(Hmisc) # rcorr
# library(WGCNA)
library(gprofiler2)
# set gprofiler version
set_base_url("http://biit.cs.ut.ee/gprofiler_archive3/e106_eg53_p16/")
# library(sva)
library(WebGestaltR)
library(readxl)
library(tidyverse)
select <- dplyr::select # I am adding this explicitly
rename <- dplyr::rename # I am adding this explicitly
library(downloadthis)
# setting path
library(here)
# get functions
source(here("_src/functions.R")) # source all the common functions
Figure 1A: Overview of data sets
knitr::include_graphics(here("Figure1A.png"))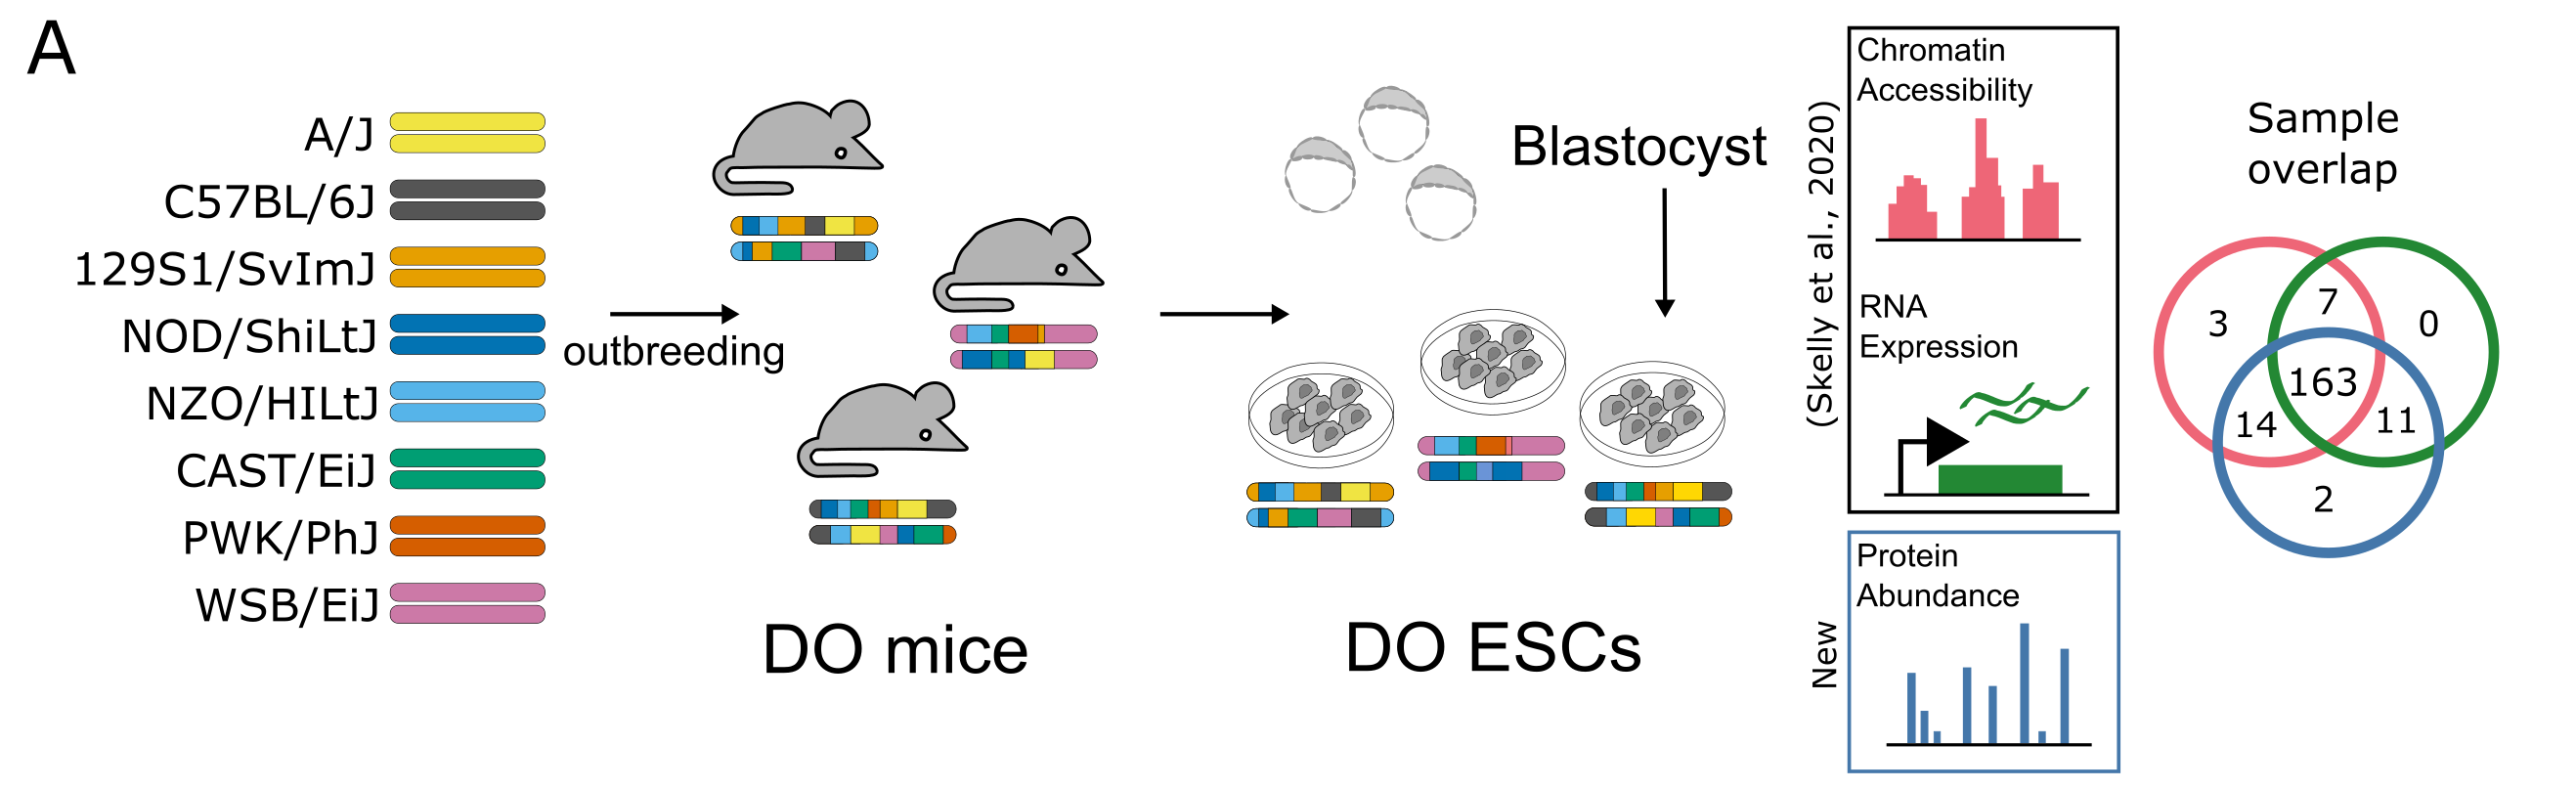
Figure 1A: Nearly 200 embryonic stem cell lines were established from blastocysts of Diversity Outbred mice, and quantified using ATAC-seq, RNA-seq (Skelly et al., 2020), and multiplexed mass spectrometry; 163 lines have all three measures.